High-growth firms and cities in the US: An analysis of the Inc. 5000
February 5, 2018
February 5, 2018
 Ian Hathaway
Introduction
Each year, Inc. Magazine publishes its list of the fastest-growing businesses in America — the Inc. 5000. To qualify, companies must be independent, privately-owned, domiciled in the United States, and meet certain revenue thresholds. Of qualifying companies, those with the fastest three-year revenue growth rates are selected.
Inc. 5000 firms exhibit very high growth compared with their peers, which makes them vital to the economy. For example, the companies analyzed here increased revenue by 43 percent each year at the median and employment by 35 percent at the median. By comparison, the median business for the whole economy expands revenue by about three percent each year and doesn’t increase employment at all.[1]
In view of that, this post analyzes the Inc. 5000 data for the years 2011 to 2017, with a focus on those companies meeting the standard definition of high-growth established by the Organization for Economic Co-operation and Development (OECD).[2] The industry representation of these companies, their geographic distribution across the U.S., and factors explaining regional variation of Inc. 5000 high-growth firm “density” are explored.
Overall, this analysis underscores the importance of high-growth firms to the economy, highlights the regions where those firms are most prevalent, and provides insight into some factors associated with the variation of high-growth businesses across regions.
Dating back to the mid-1990s, economists have identified that a small number of high-growth businesses account for most job creation in the United States. According to this early work, just four percent of firms—the “gazelles”—accounted for 60 percent of job creation during the late-1980s and early-1990s.[3] A more recent study by the Bureau of Labor Statistics produced findings of a similar magnitude, showing that 2.4 percent of firms accounted for 40 percent of new jobs from the mid-1990s to the late-2000s.[4]
Most recently, economists at the Census Bureau assessed firm growth by employment and revenue during the last few decades, using administrative data from official sources (business registry and tax data).[5] This work demonstrated that firms achieving one-year growth rates in revenue above 25 percent account for 12 percent of firms but 50 percent of economy-wide revenue in a given year. Businesses achieving one-year employment growth above 25 percent account for 17 percent of firms yet 59 percent of job creation.
These findings, along with a sizable body of research literature spanning the U.S. and European economies, point to several stylized facts about high-growth companies:[6]
With this set of facts in mind, a novel dataset of high-growth firms—the Inc. 5000—is analyzed next.
In collaboration with Inc. Magazine and the Center for American Entrepreneurship, data from the Inc. 5000 lists spanning 2011 to 2017 are analyzed here. Of companies that qualify, those selected have the fastest three-year growth rates in revenue between the year prior and three years prior to that.[7] For example, companies in the 2017 list are evaluated based on growth performance between 2013 and 2016, and so on.
The 35,000 company “entries” (seven years x 5,000 companies per year) is restricted to those meeting the OECD definition of “high-growth”—annualized revenue growth of 20 percent or more each year during a three-year period, or 72.8 percent over the entire three years.[8] This yields more than 25,000 company entries over the seven years of Inc. 5000 lists, of which there are more than 14,000 unique companies.
The table below provides some descriptive statistics on the size, age, and growth rates of these Inc. 5000 high-growth companies (I5HGCs).

As the table shows, the average company has $37 million in revenue, 199 employees, three-year growth rates of 578 percent in revenue and 319 percent in employment, and is aged 8 years. When looking at the middle of the distribution (median), the companies are younger, smaller, and growth is less pronounced.
Turning to areas of economic activity, the chart below plots the 25,776 I5HGC entries by industry. (Note: these industry descriptions are provided by Inc. Magazine and do not fit standard government industry classifications such as NAICS.)

I5HGCs are concentrated in a relatively small number of industries. Six of the 26 industries account for 52 percent of I5HGC entries, and 80 percent of entries are in the top 13 industries. The three information technology industries—IT Services, Software, and Computer Hardware—account for 21 percent of I5HGCs. The other predominantly high-tech industry—Health (which includes biotechnology and medical technology)—accounts for another eight percent.
Taken together, the traditional high-tech industries account for 29 percent of all I5HGCs. That reveals two important insights. First, companies in these industries are much more likely than companies overall to be I5HGCs (they account for about five percent of firms across the entire economy).[9] Second, that means more than 70 percent of I5HGCs are in non-high-tech industries. That’s an important point for policy: though high-tech firms are much more likely to be high-growth, not all high-growth firms are high-tech. In fact, the substantial majority are not.
Taken together, the I5HGCs have five defining characteristics:
These characteristics are consistent with the broader research literature on high-growth firms, which is encouraging because the Inc. 5000 has two limitations: it doesn’t draw from the entire universe of qualifying firms (only those that apply), and the underlying data is not drawn from official government sources. So, while the Inc. 5000 is an imperfect measure of the “true” universe of high-growth private firms in America, it appears to be a fairly robust source for the study of them.
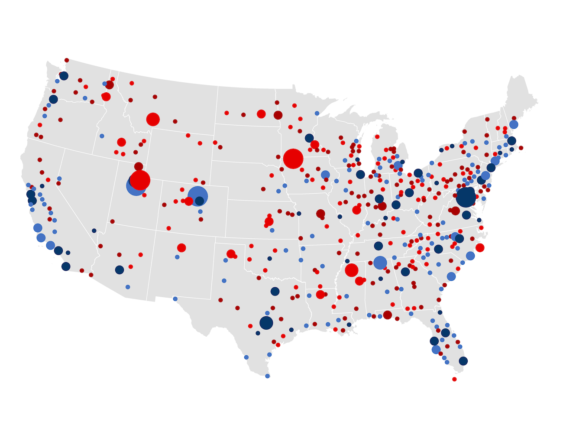
An analysis of the geographic location of I5HGCs reveals another concentration—this time by place. The figure below shows that nearly 98 percent of I5HGCs are located in metropolitan areas. Micropolitan and rural areas are headquarters to just two percent.

The pattern is clear: the substantial majority of I5HGCs are located in large metropolitan areas (those with one million or more residents). However, medium-sized metros (those between 250,000 and one million residents) make a meaningful contribution as well. In fact, on a population adjusted basis, medium-sized metros as a group have a higher “density” (I5HGCs per one million residents) than do large metros. This is evident by the concentration of medium-sized metros among the densest cities for I5HGCs.
Drilling down further, the figure below plots the top 25 metropolitan areas for I5HGC density. Of the top four metros, three are medium-sized—Boulder, Provo, and Huntsville. Only Washington (a large metro) is not.
The top 25 metros for I5HGC density have a good representation across metro sizes. Eight medium-sized metros made the list (Boulder, Provo, Huntsville, Charleston, Trenton, Cedar Rapids, Durham, and San Luis Obispo), as did three small metros (Columbia, Charlottesville, and Fargo). The 14 large metros include well-known hubs of high-tech and knowledge-intensive activities.
Though not shown here, 12 micropolitan areas have I5HGC density that would place them among the top 25 metros. This is largely on account of their small sizes, but a few have I5HGC entries in the double digits. Among the micropolitan areas with leading I5HGC density are Spirit Lake, Iowa.; Summit Park, Utah; Bozeman, Mont..; Oxford, Miss.; and Breckenridge, Colo. At 21 company entries, Bozeman had the most, followed by Summit Park’s 14 company entries.


To assess which factors are associated with regional I5HGC density, a linear regression analysis (OLS) was conducted. The explained or dependent variable is the number of I5HGC entries per one million residents (I5HGC density) during the period among the 303 US metropolitan areas for which a full set of control variables could be collected.
The impact of nearly two dozen explanatory or independent variables on I5HGC density were tested—each considered on the basis of a vast research literature.[10] Most of these factors (20 of 23) held statistically significant correlations with I5HGC density, but failed to maintain those relationships when considered jointly with other factors.
For reasons of brevity, the results of the regression analysis will only be summarized here, highlighting the variables that have the deepest associations with I5HGC density across metropolitan areas during the period of analysis. For a more thorough discussion of the regression modeling and the results of that analysis, please see Appendix A to this report.
The simple regression model utilized explains about two-thirds of the variation of I5HGC across metros, which is a pretty good result for this type of analysis. Four variables are especially important:
Overall, the results indicate that a well-educated workforce, a concentration of high-tech activity, a critical mass of mid-career professionals, and an experience-base and culture that is oriented towards entrepreneurship, may explain a sizable portion of the variation in I5HGC rates across metropolitan areas.
Given its availability, richness, and consistency with more comprehensive and official datasets on high-growth firms, the Inc. 5000 makes a valuable resource for improving our understanding of these vital sources of economic growth.
This analysis shows that I5HGCs have a similar size, age, and industrial composition as do high-growth firms in the broader literature. And, predictably from theory and empirics on modern economic growth theory, these knowledge-intensive firms are predominantly found in cities—in particular, large and medium-sized cities that have a high density of college-educated workers, high-tech activities, mid-career professionals, and a well-established culture and experience-base of entrepreneurship.
As the U.S. and many other aging nations look to sources of economic growth, this work indicates that they should place innovative, young, high-growth firms at the top of the list. As an extensive body of literature demonstrates, these companies, though relatively few in number, play a central role to economic growth overall.
Though these findings should be interpreted with some caution—the results are based on limited data, descriptive statistics, and simple multivariable correlation techniques—they suggest a few areas for policy consideration. These include the development of a well-educated workforce; the promotion of competitive high-tech and knowledge-intensive services industries; and the relevance of entrepreneurial support, mentoring, and knowledge-sharing initiatives.
Demographics should help, as an increase of prime entrepreneurship-aged individuals is on the horizon, but policymakers should also consider liberalized immigration policies—particularly for individuals who wish to come to the United States to start growth-oriented businesses, or those who choose to do so after being educated in American universities.
Finally, it is worth stressing that high-growth entrepreneurship is fundamentally a local phenomenon, which will occur primarily in cities for the foreseeable future. To that end, local officials in metropolitan areas should pursue a broad agenda of direct and indirect policies (housing, schools, amenities, transit, livability, etc.) that support these high-growth, knowledge-intensive companies and attract the people who found them.